
Heatmap & Visualizations
From the outset, a large goal of the project has been to gather data in a manner that allows advanced visualizations of the subgenre. That's a big part of why we use a numerical scale with a large range when asking questions in the survey!
Right now we're still very focused on gathering data, but we've done a little work to visualize it with regards to heatmaps, bubble plots and more advanced visualizations. We've also gone through the entire database and made sure it's well labeled and easy to import if you want to try your own!
Heatmaps

A 'heatmap' is a way of color coding large amounts of data in order to more easily understand them at a glance. We mathematically determine colors between set values based on the numbers. Now that we've got the website up, you can select any game and see the associated heatmaps!
As of the end of October 2023, the heatmap scale has been changed from a three color red-yellow-green to this gradiated blue/green scale designed to make it more clear that the scale measures similarity and not quality, with gray for 'planned' and 'unknown' values (which count as 0 in the scale.)
It's the same process used to determine the colors of the table cells in the ranking view.
It's a little harder to see a zoomed out heatmap of the entire database, for which the original google sheet is still the best option. You can 'print' the entire thing to a pdf, for example, and get a very zoomed out view!
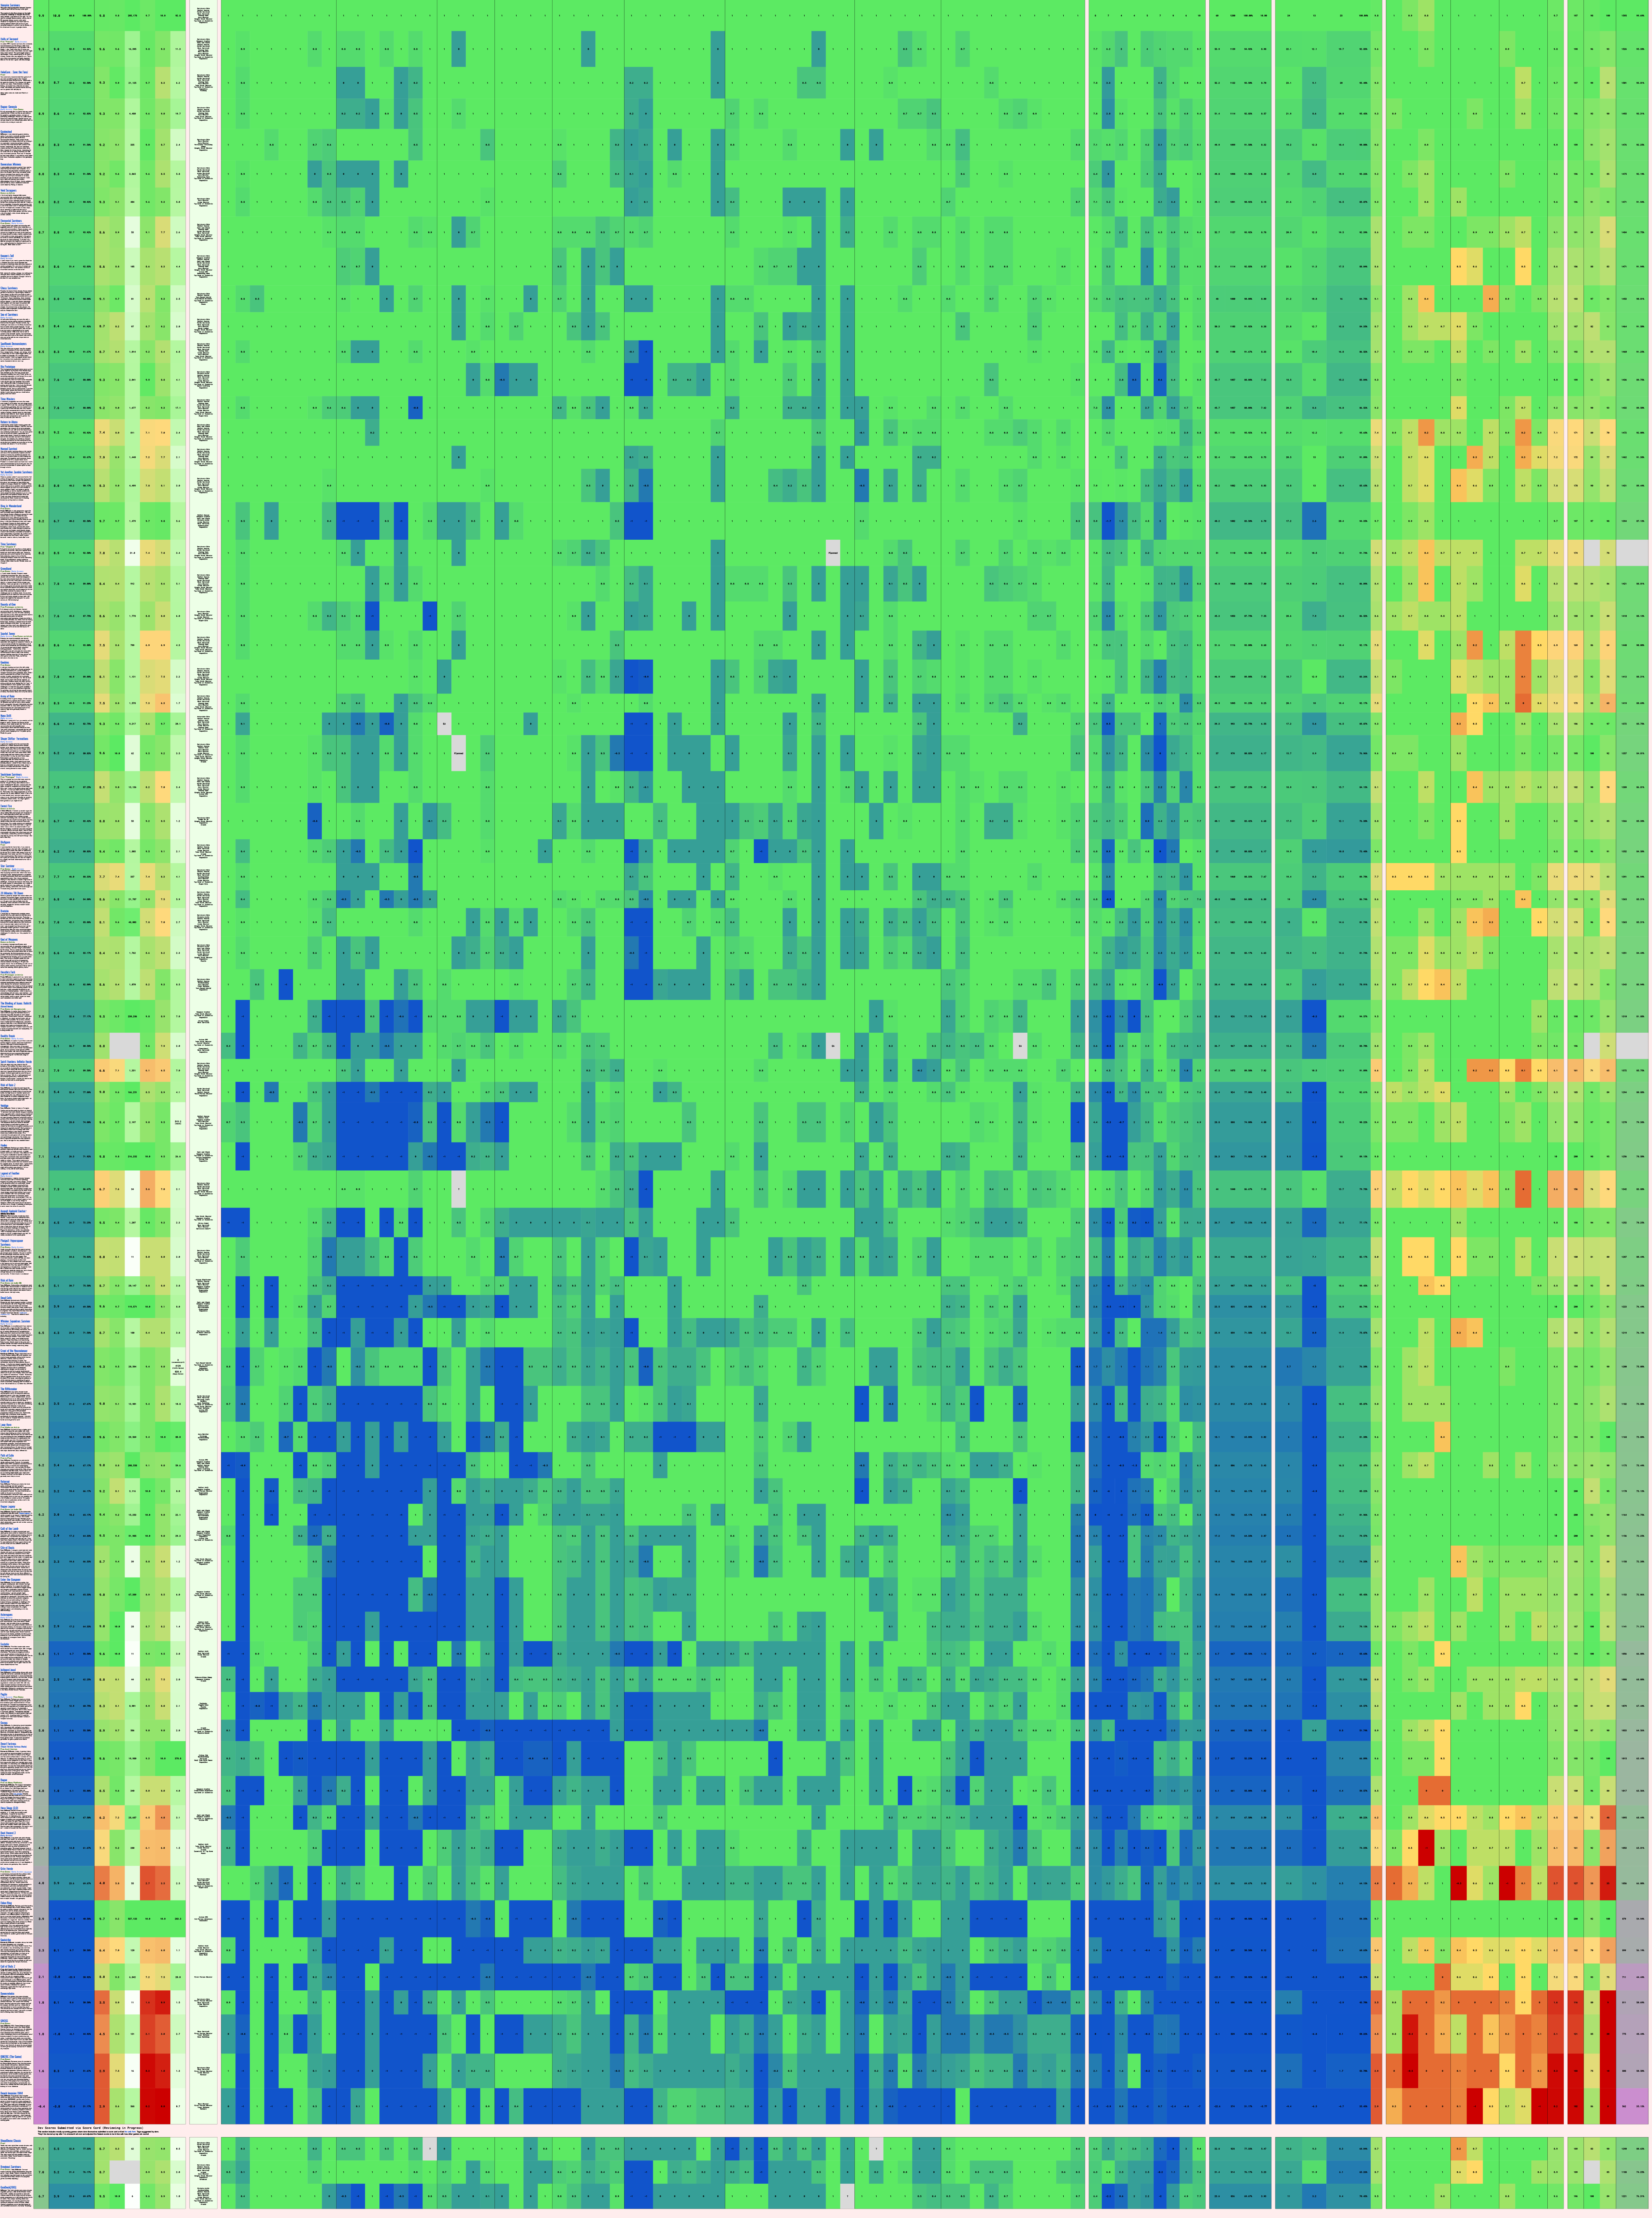
The above is the whole ranked section on 11/2023! You can see the review section in the warm tones to the right. Google sheets makes it very easy to generate a heatmap using conditional formatting to determine color values. We've got a little bit of code that does the same process on the imported data for the website.
Here's a glance at an earlier version of the scale before we shifted to a blue-green range for similarity (which is less judgemental feeling).

Bubble Plots
A bubble plot lets you cram a bit more information into a 2d graph. In our example here, we split the 60 categories into 3 groups, a Genre & Game Design axis, a Controls & Interface Complexity Axis, and then we use Depth and Breadth of Content to determine the size of the bubble. You can see the math and data here.
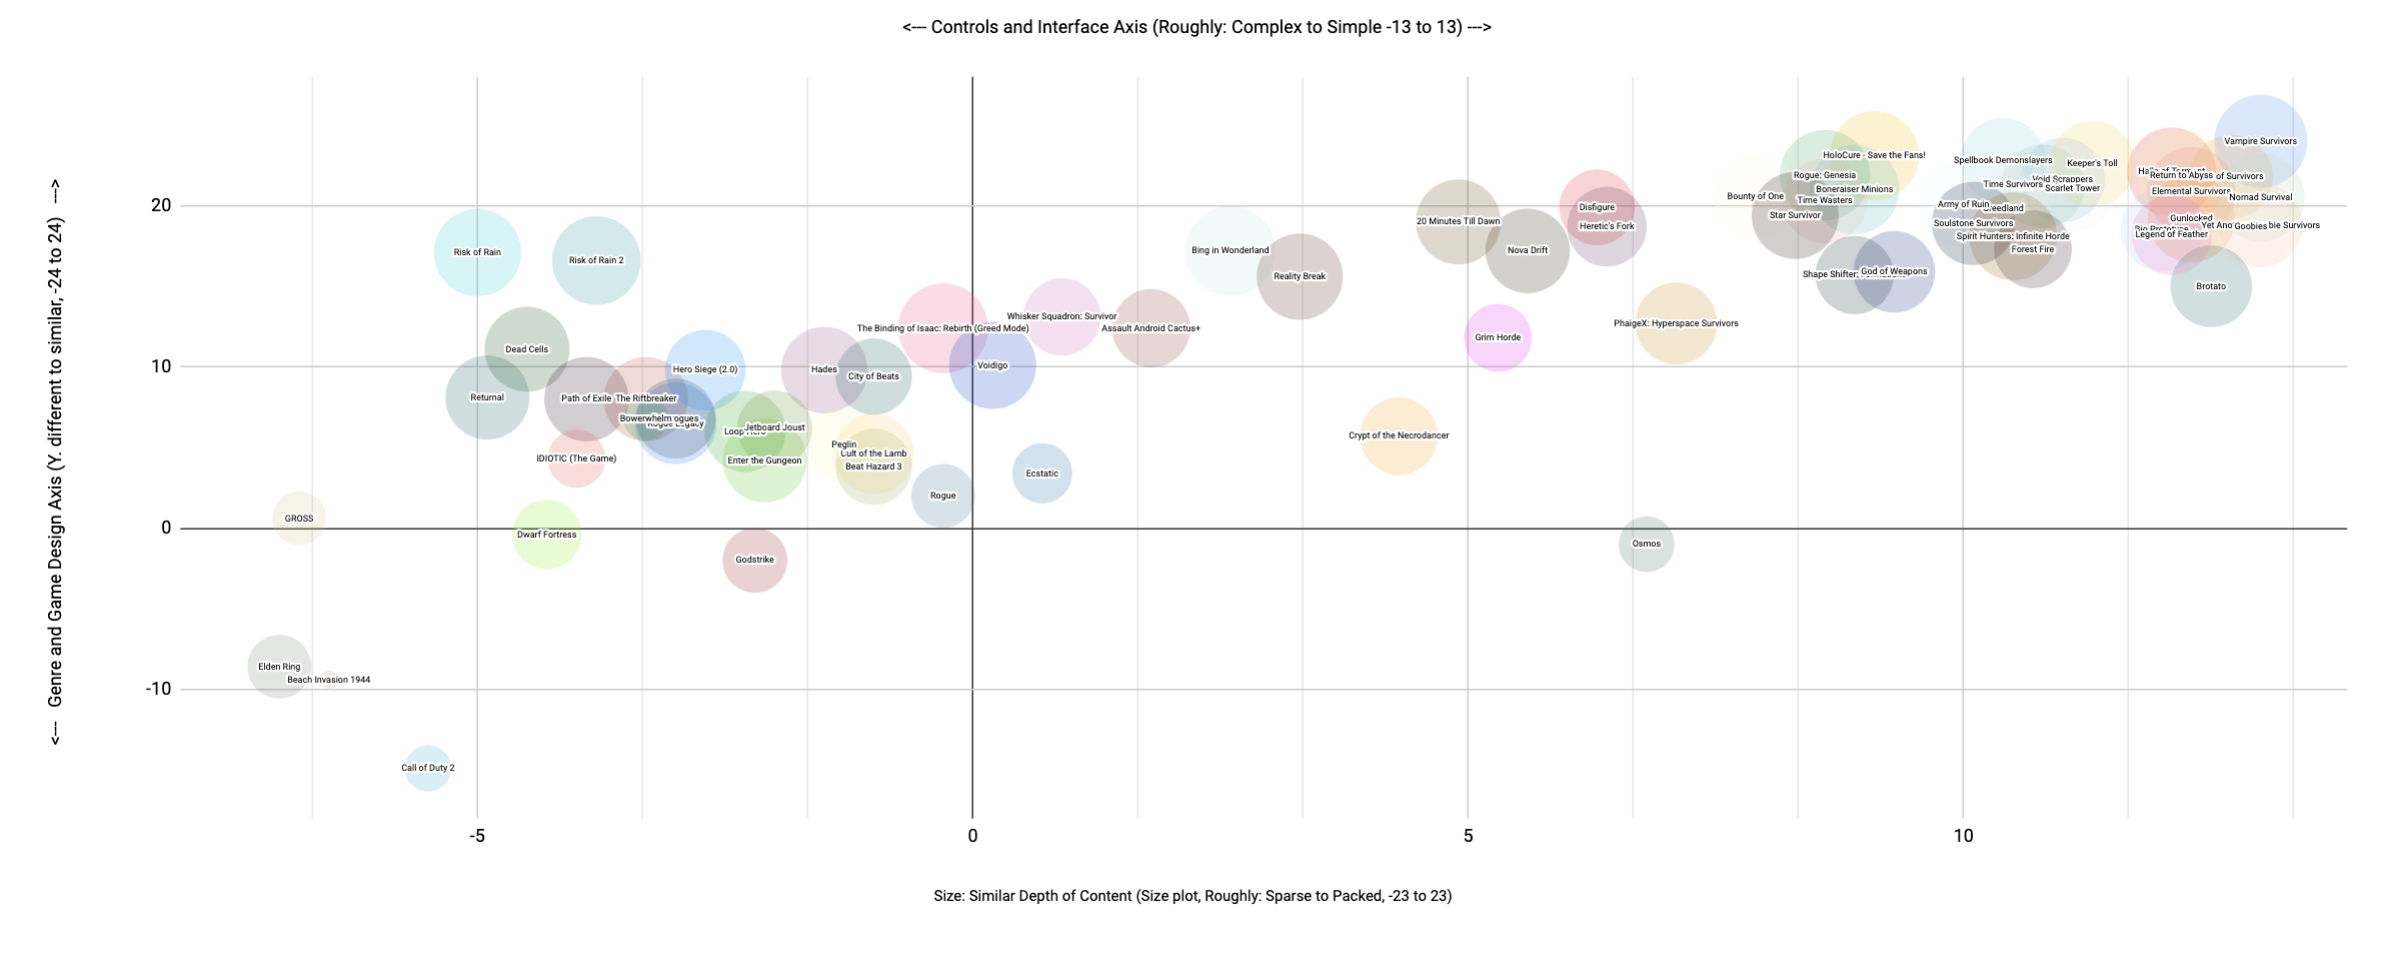
You can click on these images to zoom in. This is a plot of the first 70 or so games ranked on the scale, including the 10 we used to 'test' it. So far, it's very promising!
This cluster here shows a great deal of similarity between popular games discussed using the terminology we're studying. That may seem kind of obvious at this point, but it shows the words have a distinct meaning that's quite measurable!
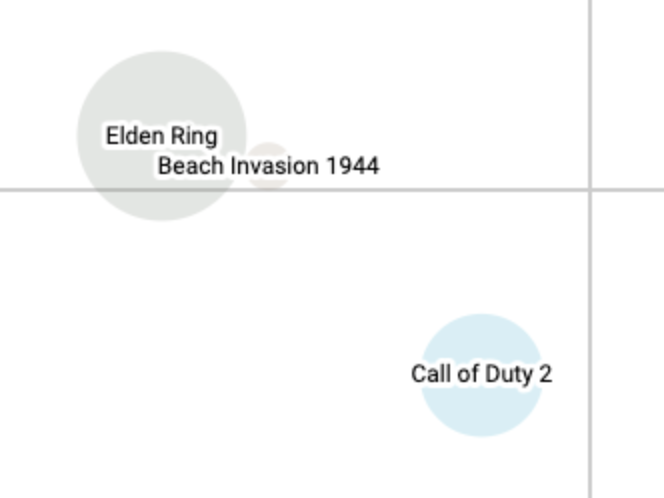
Likewise, the games we reviewed as part of the Steam Bullet Heaven Fest that felt very different fell where we might expect, near the very different game we used to test the scale, Call of Duty 2. While similarly different in gameplay mechanics, the small size of Beach Invasion indicates the small amount of content and the low quality of gameplay compared to the other nearby titles.
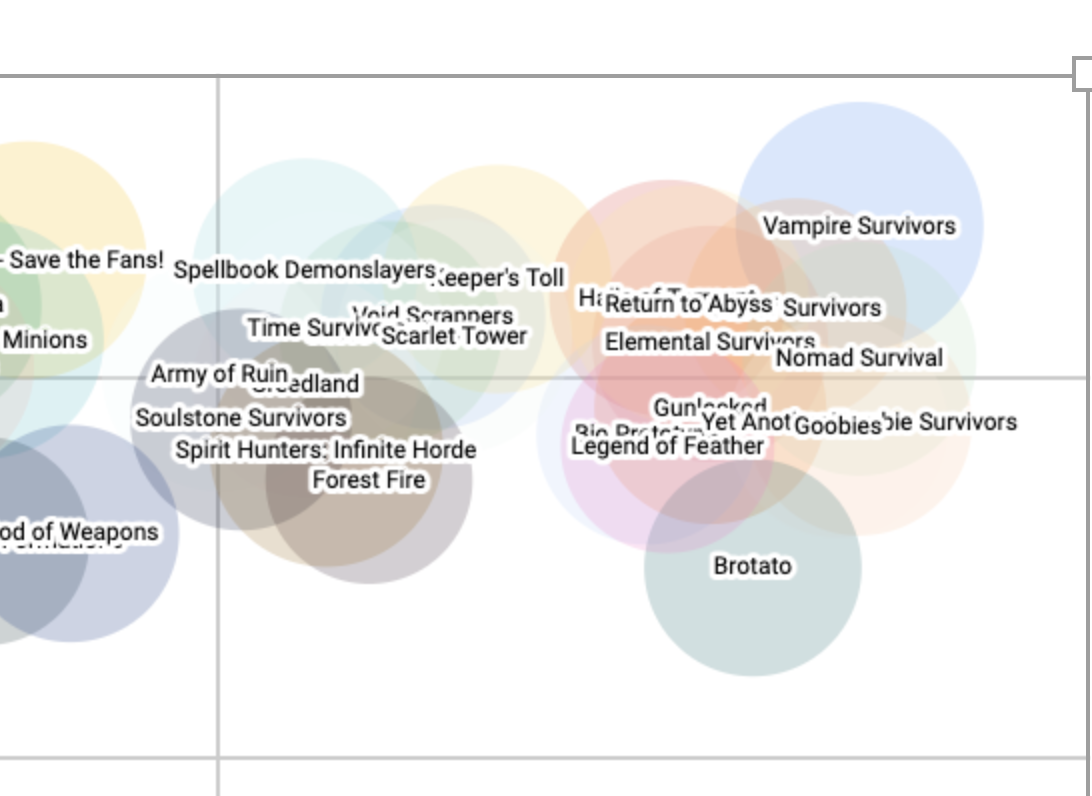
Zooming back out, even with just 70ish games out of the 800+ we've set aside to study, we can see a clear area that seems to define the subgenre:
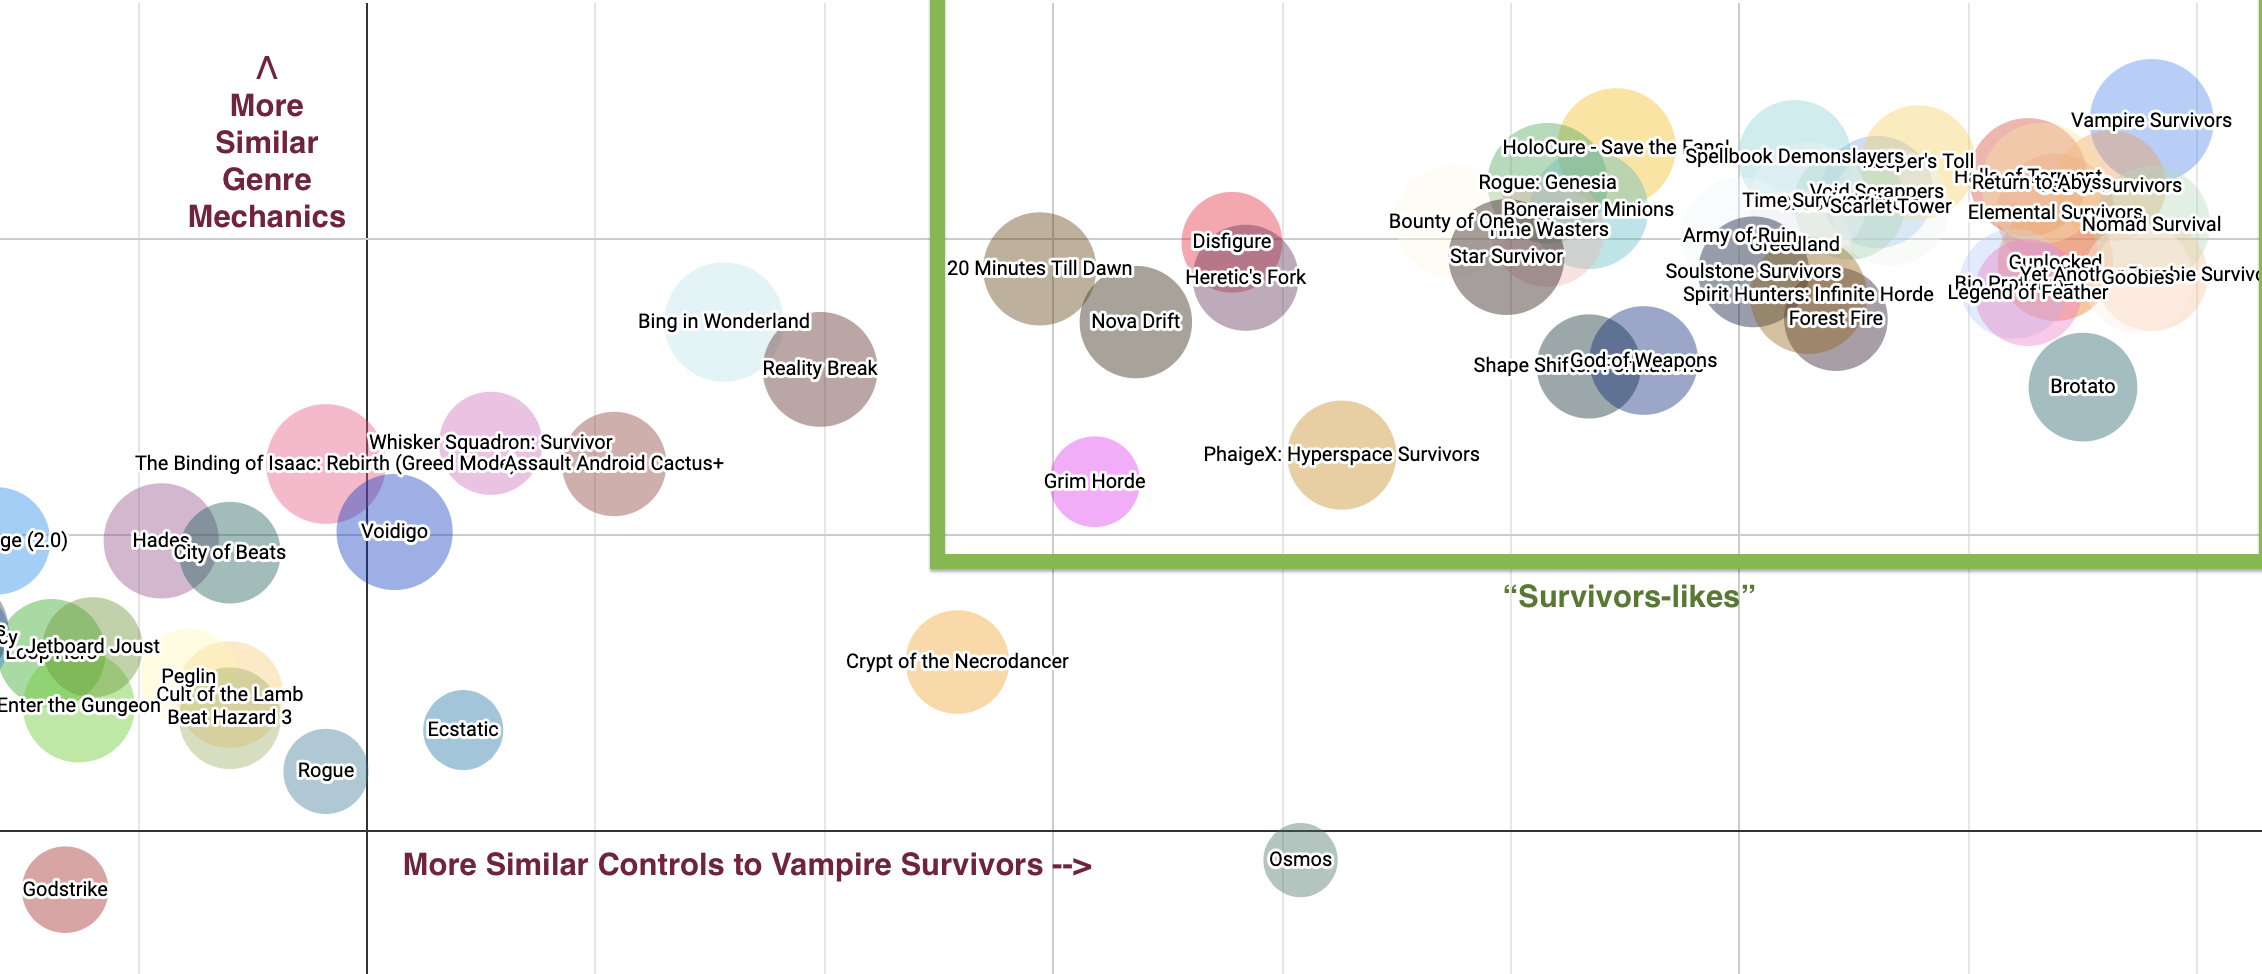
It looks like we've successfully invented a scientific process for determining survivors-likes! Of course, with the major caveat that games like Whisker Squadron: Survivor will always be out there pushing the boundaries of any genre - and we tend to embrace that as players!
We could add even more information to this 2d graph, for example by coloring our bubbles based on the review score! But perhaps even more exciting are the..
Advanced Visualizations
We're mostly leaving playing with this until we've got more data in the dataset, but this is where it gets really fun!
We can load our data into a variety of advanced visualization software models and explore it in countless ways. We can plot on 3 axes.. or even more!
Here's an example quickly created from the same dataset used to make our bubble plots:
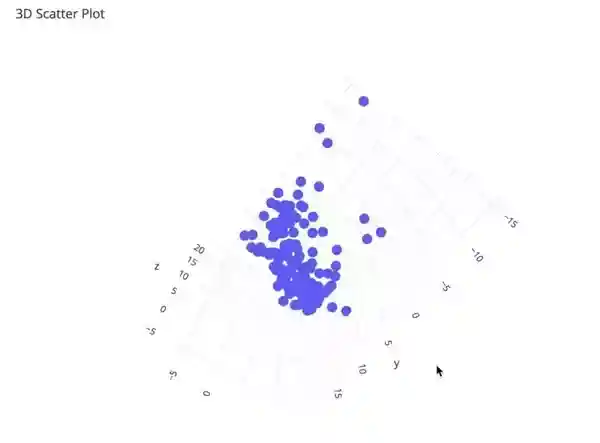
These tools will let users filter in on what's important to them in a variety of fun ways and tell us who knows what about how game design works.
Right now, our biggest goal is just gathering the info! If you're a game creator, please consider helping with our efforts by submitting a dev survey about your game!
Soon we'll have embedded visualizations here that you can manipulate yourself!